Smart zooming
If you are using hierarchical aka nested coding, you can use ordinary zooming to “zoom out” your map to give a simple, more general overview. But sometimes this can mean oversimplifying your map: there are lower-level factors which are so important and popular that it is unhelpful or even misleading to roll them up into a parent factor. Smart zooming solves that problem.
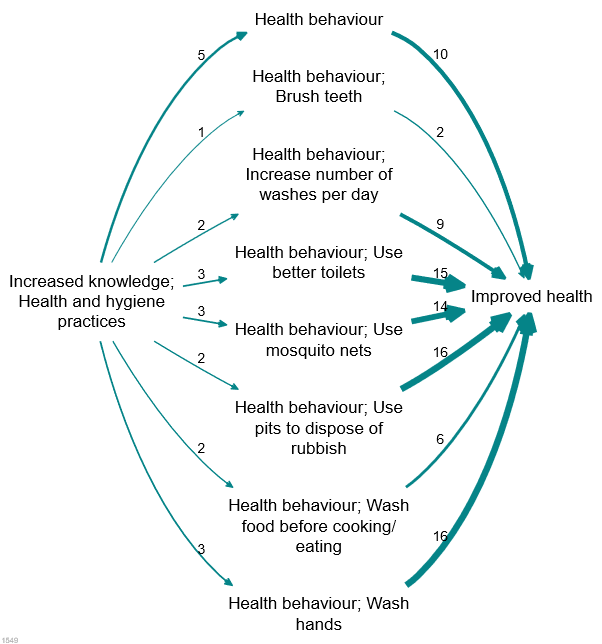
Assuming we have a causal map which has used nested coding, as in the small but detailed map shown above, how do we take advantage of this coding to “zoom out”?
Here is the same map, zoomed out to level 1 (i.e. there are no semi-colons at all).

A weakness of hierarchical zooming is already visible in the example, we have lost a lot of the important detail. In many cases we may be happy to see all the factors “rolled up” to the top level but in the above example, there are a variety of types of health behaviour discussed and this detail has been lost. So what can we do?
A smarter approach is achievable with this smart zooming, which tells the app: only “roll up” a nested factor into a higher-level factor if it has a frequency (simple frequency, or source count) lower than some cut-off value; otherwise, keep it separate.
This is an improvement over zooming because it keeps the detail where necessary and removes it where it is not. It will roll up infrequent factors into their parents but only if they are infrequent; if you have a very granular factor like “health behaviour; Use better toilets” which actually has a lot of mentions, then it won’t get rolled up.
The above example can be rolled up to this:
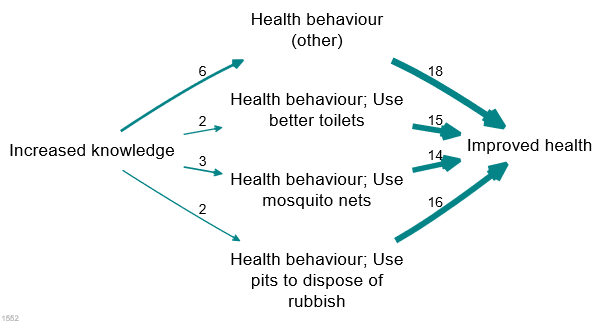
This is an improvement because it still has a small number of factors, retaining frequently-mentioned factors but wrapping up infrequently-mentioned detail into higher-level concepts.
This isn’t available using the buttons yet but you can use the Advanced Editor. The code is:
zoom factors level=1 preserve_frequency = 5You can use source_count instead:
zoom factors level=1 preserve_frequency = 5 frequency_field = source_countOne thing which is not yet clear is whether the resulting pair of factors “Health behaviour” and “Health behaviour; hand_washing” should be distinguished in any way. For example, perhaps it isn’t obvious, looking at “Health behaviour”, that this higher-level factor excludes in this case its actual daughter, “Health behaviour; Hand washing”.
What the app does provide is the additional field in the factors table: frequency preserved . So if you want, you can highlight factors which are not rolled up, for example like this:
color borders field="frequency_preserved" hi=red lo=whiteHere is a real-life example.
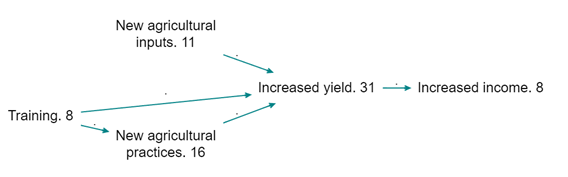
A top-level map, zoomed out to level 1 (source counts are shown). As you can see this map is quite simple with no additional details.
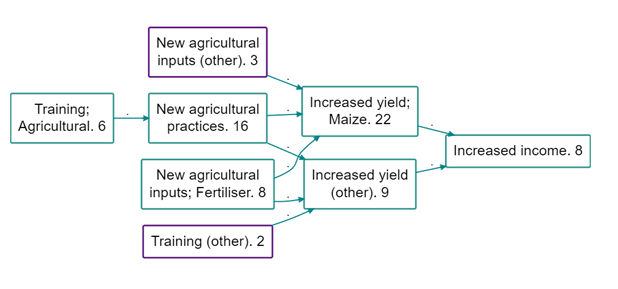
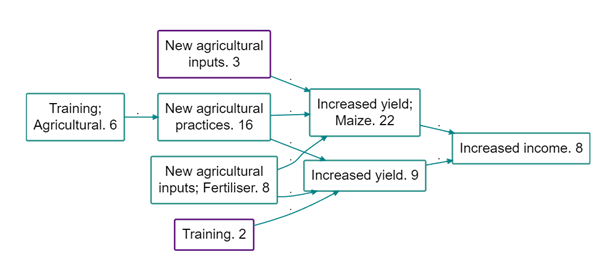
And here is the same map but preserving factors with a source count above 5. This seems like a real improvement as some really concrete and important second-level factors are preserved, including for example that the training mentioned on 6 occasions was agricultural training and that fertiliser was mentioned as a driver of change.
The factors with a purple border have been ‘rolled up’ and only their top-level label is visible. The other factors have been preserved and are displayed in full, as they have a frequency count higher than 5 or because they are a level one label and so cannot be ‘rolled up’.
Probably the best way to do this is to add “(other)”, or whatever else you type, on to the ends of the higher-level factor labels which have larger child factors elsewhere in the map. Larger child factors are those which are not rolled up because they are so frequent, like ‘New agricultural inputs; Fertiliser’ in the below map. To do this add frequency_other= (other) in the advanced editor on the same line as your commands to preserve factors whilst zooming. This will create a map like below: