Analysing a file
Analysing a file means
applying different filters to it, to focus on different parts of the entire causal map in order to answer different questions
viewing the results in different ways by clicking on different tabs in the right hand side to view different kinds of graphical map and various tables.
If you want to view / analyse a file, you will mostly:
- apply filters using the Dashboard and view the results in the right-hand side of the app.
- view many statements at a time by clicking
Manyon the multiple statement selector (above). - start off by analysing the example-file.
Background information about filters
The information in this section is just for orientation, you don’t need to remember it because you will probably find it much more convenient to use the dashboard.
Filters simplify your graph to help you answer specific questions. You will often apply more than one of these filters in order, e.g. first select only specific factors and then make the most frequently mentioned factors larger. There are different kinds of filters:
- Analysis filters, e.g. to exclude some links and/or factors from the map. So instead of seeing the entire unfiltered causal map, which can be quite bewildering, you see only part of it.
- Conditional formatting filters. You can format the links and factors in your map to reflect the data, e.g. you can make factors bigger if they were mentioned more often.
- Simple formatting filters. These are simply used to apply overall formatting, e.g. give all the factors a grey border.
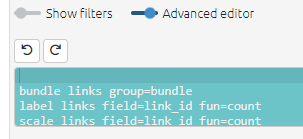
The filters are actually specified by special text in the Advanced Editor (which you can view if you want, but close the window if it scares you). The text window uses a simple syntax for filtering and manipulating the maps and tables. Each line in this window is a filter which manipulates the existing map in some way. The lines in the windows are applied successively to the original map to produce the final map which is then displayed.
You won’t need this window at this stage.
You can use the other buttons on the left-hand side to manipulate this filter text more easily. Each button corresponds to one line.
Most people like to hide these filters when they are coding, so they hide the filters using the toggle.

But for analysing your map, you may want to open the filters panel using the toggle.
If you are just beginning with analysis, you will probably just use the Dashboard – it’s easier!