Uploading your data
This page tells you how to get your data into the right format for uploading to Causal Map. There are different formats to choose from: pick the one which is most convenient for you.
Currently, you can work with 5 different types of formats in the Causal Map App, they are:
- Text documents: you can upload multiple text files, doc, docx, or pdf files.
- Standard format Excel: an Excel file with one worksheet called
statementswith one row per statement and optionally other worksheets forsourcesetc. - Wide format Excel: an Excel file with one worksheet containing row for each source, one column for each question. e.g. data from Google Forms.
- Hybrid format Excel: an Excel file with one worksheet containing one row for each answer and includes the statements as one kind of answer but also includes rows for additional data like gender.
- Links-only Excel: an Excel file with just one worksheet called
linkswith just the columnsfrom_labelandto_label. When you want to analyse causal links from elsewhere.
🧪Uploading text documents including Word and PDFs
If your data is in the form of several word processing documents like Word .docx or .odt, or plain text documents or even PDFs, you don’t need to bother with Excel files, you can just upload your text files directly.
Preparing your files: If you wish, in your doc, docx and text files, you can separate text into statements by inserting lines containing just -- (that is two hyphen characters together) where you want to separate statements, like this.

Otherwise, doc and docx files will be broken into paragraphs and pdf files will be broken into pages.
You can also use the same trick to add question_id and respondent_id to your upload, like this:
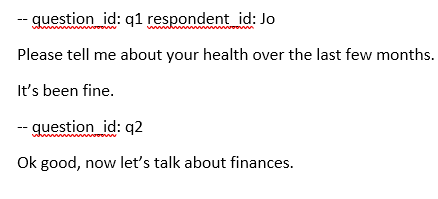
That means you can add, at the top of your statement after the --, exactly one or other of these:
question_id:followed by the ID of the question (a single string of characters with no spaces) and/or- exactly the text
respondent_id:followed by the ID of the respondent (a single string of characters with no spaces)
You don’t need to do this for every statement, only where the question_id or respondent_id changes. So add it for every new question and/or every new respondent.
Wait, you say, what’s a respondent? Well we already have source_id which is the name of the document. Usually you will have one document for one respondent, so you won’t need respondent_id. You will usually only want to use respondent_id when your respondents change within one document, for example in a focus group transcript.
Alternatively, if you want to mark different sources within one or more documents, you can put lines like this within your document.
--source_id: my source id
Uploading like this does not retain information about page numbers in PDFs. If you need to get the page numbers of each statement when uploading PDFs, try another free utility (Tool 2) which uploads PDFs only but does provide page numbers as an additional column.
This way of uploading your data is only intended for uploading statements for coding. Characters like $ and # which are used in hybrid import have no special meaning here.
Ignoring sections of text
If you want to ignore sections of text, i.e. not import them at all, use this special code at the start of the section.
-- question_id: !IGNORE
Everything between this and the next section (which you have marked with – etc) or the end of the document will be ignored.
Problems uploading PDFS?
This upload option may miss text in PDFs which is in boxes and columns. As an alternative you can export a PDF to Excel (one by one) here. The resulting file is also full of pictures etc but does seem to contain all of the text, although in many columns. 80% of the time it identifies suitably large chunks of text, but sometimes you get very small fragments.
We provide another our free utility (Tool 3) which batch converts any number of these Adobe Excel files into an Excel file which you can then upload to Causal Map.
Uploading a standard format Excel file
Causal Map has a standard format for storing data which can be uploaded and downloaded as an Excel (xlsx) file.
That means you can upload your data the first time using this format, and it is also the format you might later use to add more data or to add data about your sources or questions.
The video below shows you how to format and upload a set of statements for coding to the Causal Map App.
You might find it easier to start from the Excel template.
The app will upload any worksheets in your file called “statements” (required), “sources” (optional) or “questions” (optional), and also, if you need them “factors” and “links”; the app will ignore other worksheets.
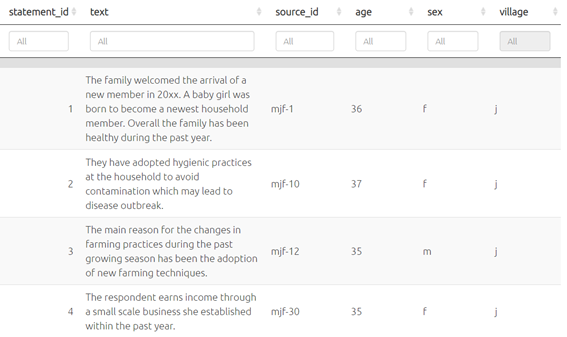
Formatting a Standard Format file
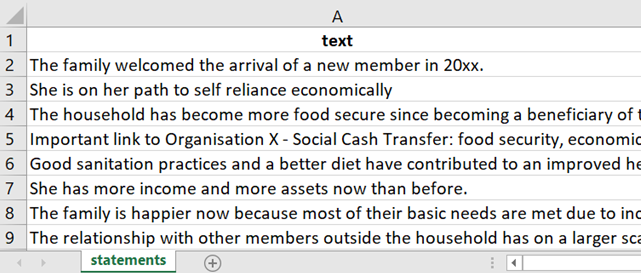
When uploading data for coding the only data you need to upload to the app is an xlsx file with a worksheet called statements. Your worksheet must have a header row with the names of the columns; the only required column, which contains the actual responses for coding, must be called text.
Each cell in the text column contains one “statement” - a chunk of text usually one or two paragraphs long. The optional other cells in the same row give you more information about that
All worksheet names and column names should be lower-case.
Pasting data from a Word document into Excel
If you are starting from Word, PDF or other text documents, you may find it easier to upload them directly. But if you want more precise control over exactly what goes into each statement and want detailed information about your sources and questions, this section tells you how to do it using a spreadsheet.
Each paragraph in your Word document will become one statement, so make sure your Word document is already structured so this will work for you. Delete any double paragraph breaks in Word (i.e. delete any empty paragraphs). If you want some short paragraphs to appear together as one longer statement, delete the paragraph breaks between them.
Then
- Copy all the text from your document
- Create a fresh spreadsheet file in Excel (or LibreOffice Calc or similar) and select cell A2
- Paste your text.
- Type the word “text” as column header in cell A1.
- Check the statements are the way you want them. You can ignore any formatting, pictures etc which might also have been pasted in because these will disappear in the next step.
The statements are the texts which appear one by one, for you to read and code. Each statement is one row in your file.
If you want to upload interviews which are several pages each, you should break each interview into several statements. Ideally a statement consists of between one and five paragraphs – enough to fit on the left-hand side panel when it is displayed there. Usually your text breaks up naturally into sections, for example the interviews might be responses to a number of questions, so your statements might consist of one or a few paragraphs for each question.
We strongly recommend that you don’t try to upload statements which are longer than 500 words, as it is harder to code very long statements.
Your statements file must have at least one column with the text of the statements and the header for this column must be “text.” Other columns will be treated as additional data.
Providing additional data like gender
Providing additional data as additional columns in the statements table.
If you want, you can provide additional data like gender as additional columns in your statements table when you upload your data. You might want to do that if your data is already structured in this way. However, this means that you have to repeat a lot of data, as you will need to provide, for example, the gender and age etc of each respondent for every single statement they made. It is usually better to upload additional data about your sources (and questions) using separate tables, as in the next section.
Just remember that if you do provide additional columns like gender in the statements table, the app understands only text and numerical fields so it will treat dates and currency as ordinary numbers.
Uploading information about sources using a separate source table
Often it isn’t convenient to provide all the data in one table.
So in your statements table, additionally (optionally), as well as your text column you will usually have a column in the statements table called source_id and a corresponding tab called sources with at least one column called source_id containing each source id, with one row for each source, and additional columns giving more information about your sources.
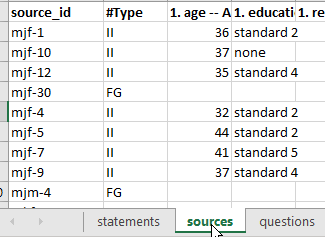
The app then merges the new information from the sources table so it is also available in the statements table and elsewhere.
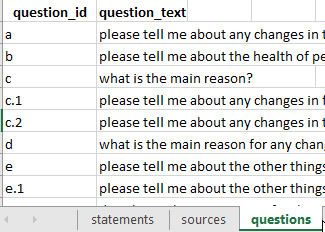
Uploading information about questions using a separate questions table
Additionally (optionally), you may have a column in the statements table called question_id . If you want, this question_id can already include the question text, e.g. “q1: tell us about your life”. But usually it is more convenient to just use a code like “q1” and also include a corresponding tab in your Excel file called questions with at least one column called question_id with corresponding values, and an additional column question_text with the full text, as well as any other information about your questions, e.g. domain or questionnaire section.
Uploading a wide-format Excel file
This is the kind of data you get if you have been using Google Forms or ODK.
In this format, you only need an Excel file with one worksheet; each row is all the data from one source. Many of the columns will probably be additional data like gender, etc. Here is an example file
Check your data:
The app will read the first worksheet and will ignore other worksheets in the Excel file.
Each row is one source.
Rename your columns:
Columns beginning with $ are treated as statements.
Columns beginning with # are treated as important additional information.
So this means that if you want a column to be treated as a statement, i.e. you want to code the answers in Causal Map, add a $ at the beginning of the column name.
If you want a column to be treated as important additional data, i.e. you want the information to be easily identified for crosstabulation and other analyses in Causal Map, add a # at the beginning of the column name.
Note that some survey software like Google Forms may restructure the answers from some kinds of questions into multiple columns. So a question like Age range may end up as several columns like Age range_Babies (1-18 months) Age range_Toddlers (18 months - 3 years) Age range_Early childhood (3-5 years) Age range_Middle childhood (5-11 years) Age range_Adolescence (12 - 18 years) Age range_Young adults (18+ years) – etc. You might want to preprocess these kinds of column groups into single columns before importing.
Adding additional cases with wide-format files
You can start coding your data even if you do not yet have all the cases/sources. When you get more data, simply add them to the bottom of the original file and upload again. You don’t need to do “roundtripping”. All your sources and statements will be overwritten but your coding (links and statements) will be untouched. The questions table will also be untouched. If you want to add information about your questions, for example adding question text as well as question id, you can use roundtripping.
Uploading a hybrid format Excel file
This section is specifically about uploading from a hybrid-style spreadsheet. This format is sometimes used with QuIP studies.
Here is an example file.
This format has many rows, one for each answer, and includes the statements as one kind of answer; you can upload statements and additional data from the same fieldwork file. The main differences to a normal upload are:
- Rows whose question code does not include a “$” will be uploaded only as additional data, not as statements.
- A new question ID will be constructed from the question code together with the question text.
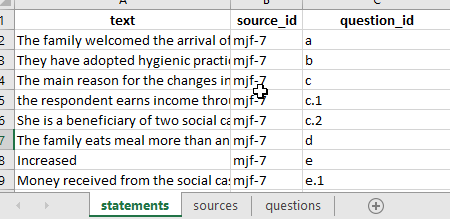
Your xslx file must have just four columns, with column headers in this order:
text, containing the answerssource_id, containing the respondent IDquestion_id, containing the question IDquestion_text, containing the question text
(Actually the names of the columns do not matter, only the order.)
Your Question IDs may include the following characters:
A dollar
$to be treated as a statement.A star
*to be treated as a closed question.A hash
#to be treated as important additional data.
Otherwise your question will be treated as unimportant additional data. Also it is worth noting that all the columns of the sources table contain metadata about your sources and can for example be used to create filters (e.g. show me a map which only contains statements from people who live alone). Data whose question_code contains a # will also be shown in a few additional key place in the app such as the info panel.
You can mix these, so e.g.
#$* Do you have a house?
Will be treated as a statement and as closed question (part of a block) and as important additional data. 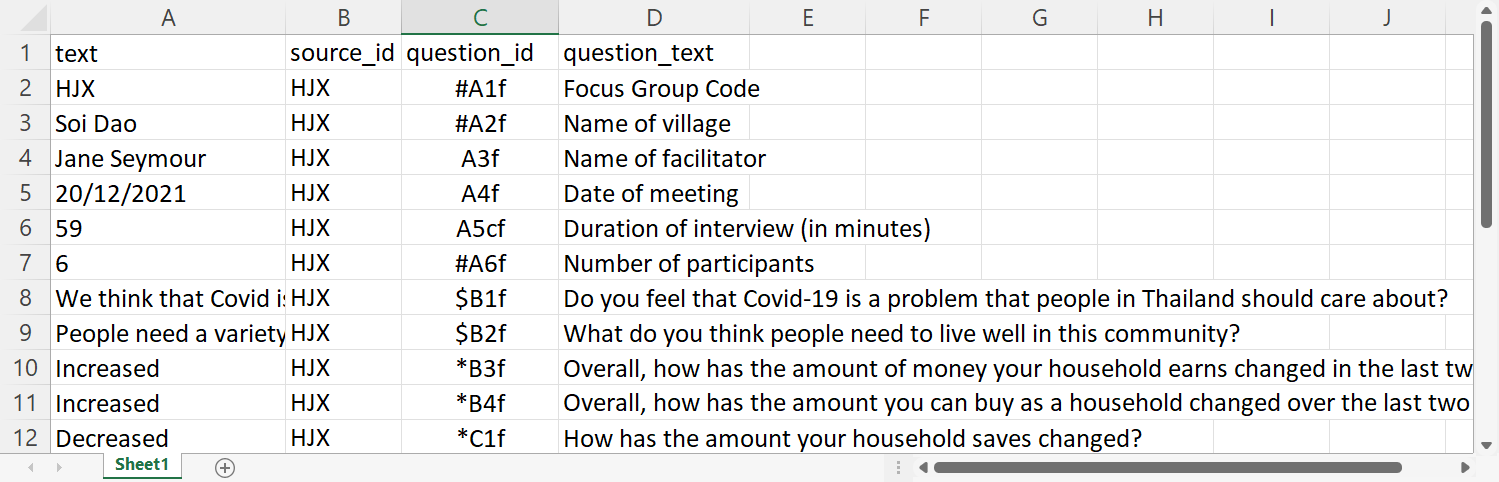
All important additional data, as indicated by the # in the question_id, can be found under the info toggle in your left-hand side panel.

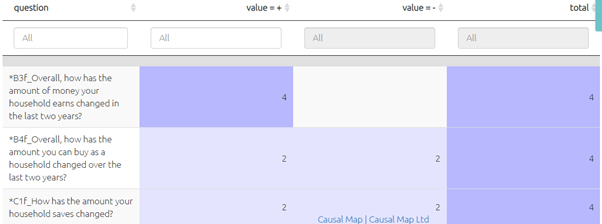
Uploading closed questions in hybrid format
Closed questions, as indicated by the * in the question_id, are treated like any other additional data for sources as shown in the picture above. Once imported, they will appear in the special closed questions table (which is really just a special view of the sources table) as well as in the the sources table itself.
Plus, the question_code may end with the characters “rank” to mark “ranking organisation” data. [There may be a bug currently such that this data will also be uploaded only if they are not treated as statements, ie the code should not contain a $].
To upload the hybrid-style spreadsheet click on the upload button on the right-hand-side panel and use the ‘hybrid’ option.
Appending hybrid data
Suppose you uploaded hybrid data from Excel spreadsheet F, and already did some coding, then you receive more data in spreadsheet G, also in hybrid format.
Find the original spreadsheet F on your computer (don’ t download from the app!). Paste the data from spreadsheet G below the existing data in spreadsheet F, save it as spreadsheet H, and upload this again. Your existing coding should not be affected; the links and factors you already created will remain.
Caveat: you can’t combine roundtripping and appending hybrid data. If you have tweaked or added to your data from file F by roundtripping (downloading the data from the app then uploading again), any changes to statements, sources or questions will be lost if you later try to append data using this hybrid button. So if you need to tweak your data (statements, sources or questions), either:
- wait until you have completed uploading using the hybrid button and only then tweak with roundtripping
- or, manually tweak the old and new data in spreadsheet H.
QuIP recodes for closed questions - live link
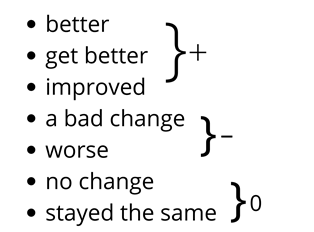
Using this table (which includes spanish) the app recodes your data into + positive, - negative and 0 neutral.
For example:
This data will be displayed in the Tables panel if you select “closed questions.”
🧪Uploading existing causal coding (“links only”)
What to do if you have causal information, for example in the form of edge lists, from some other source (e.g. AI coding of a larger text) which you want to import?
You can import this kind of file too, using the Standard Format Excel upload button.
Your Excel xlsx file should NOT have a tab for factors. Instead it should have a single tab called links, containing two columns called from_label and to_label which contain the names of your factors.
Here is an example file.
That’s the basic setup. But maybe you also want to provide information about what statement, question or source the link is associated with. In which case, these are your options:
- Optionally, your links tab can also contain other columns as usual, in particular it can contain the column
question_id. - If you include a
question_idcolumn, you should include an additional tab calledquestionscontaining at least the columnquestion_idand other columns providing information about the questions, e.g. full question text, questionnaire section etc, where relevant.
- Optionally, your links tab can also contain a column
statement_id. - If you include a
statement_idcolumn, you can optionally include, as usual, an additional tab calledstatementscontaining at least the columnstatement_idand a columntextcontaining the text of your statements.- If you optionally include a
statementstab, you can optionally also include asource_idcolumn and a corresponding tab calledsourceswith a correspondingsource_idcolumn and more columns to provide information like gender, location, or any other information about the source of each statement.
- If you optionally include a
- Optionally, your links tab can also contain a column labelled
quote, containing the actual quote which underpins each causal claim aka link. - Usually, this quote will be a verbatim section of the text in a corresponding additional tab called
statements, see above.