Your first 5 minutes with Causal Map
Let’s have a look around the Causal Map app.
Quick tour of the app
The app has two parts, the left-hand side and the right-hand side as well as the top menu. Watch the video below to see how these parts work.
Whenever you use the app, you are always working with exactly one file, the “current file”.
The top menu contains tools for managing the current file, for instance to restore earlier versions of the file.
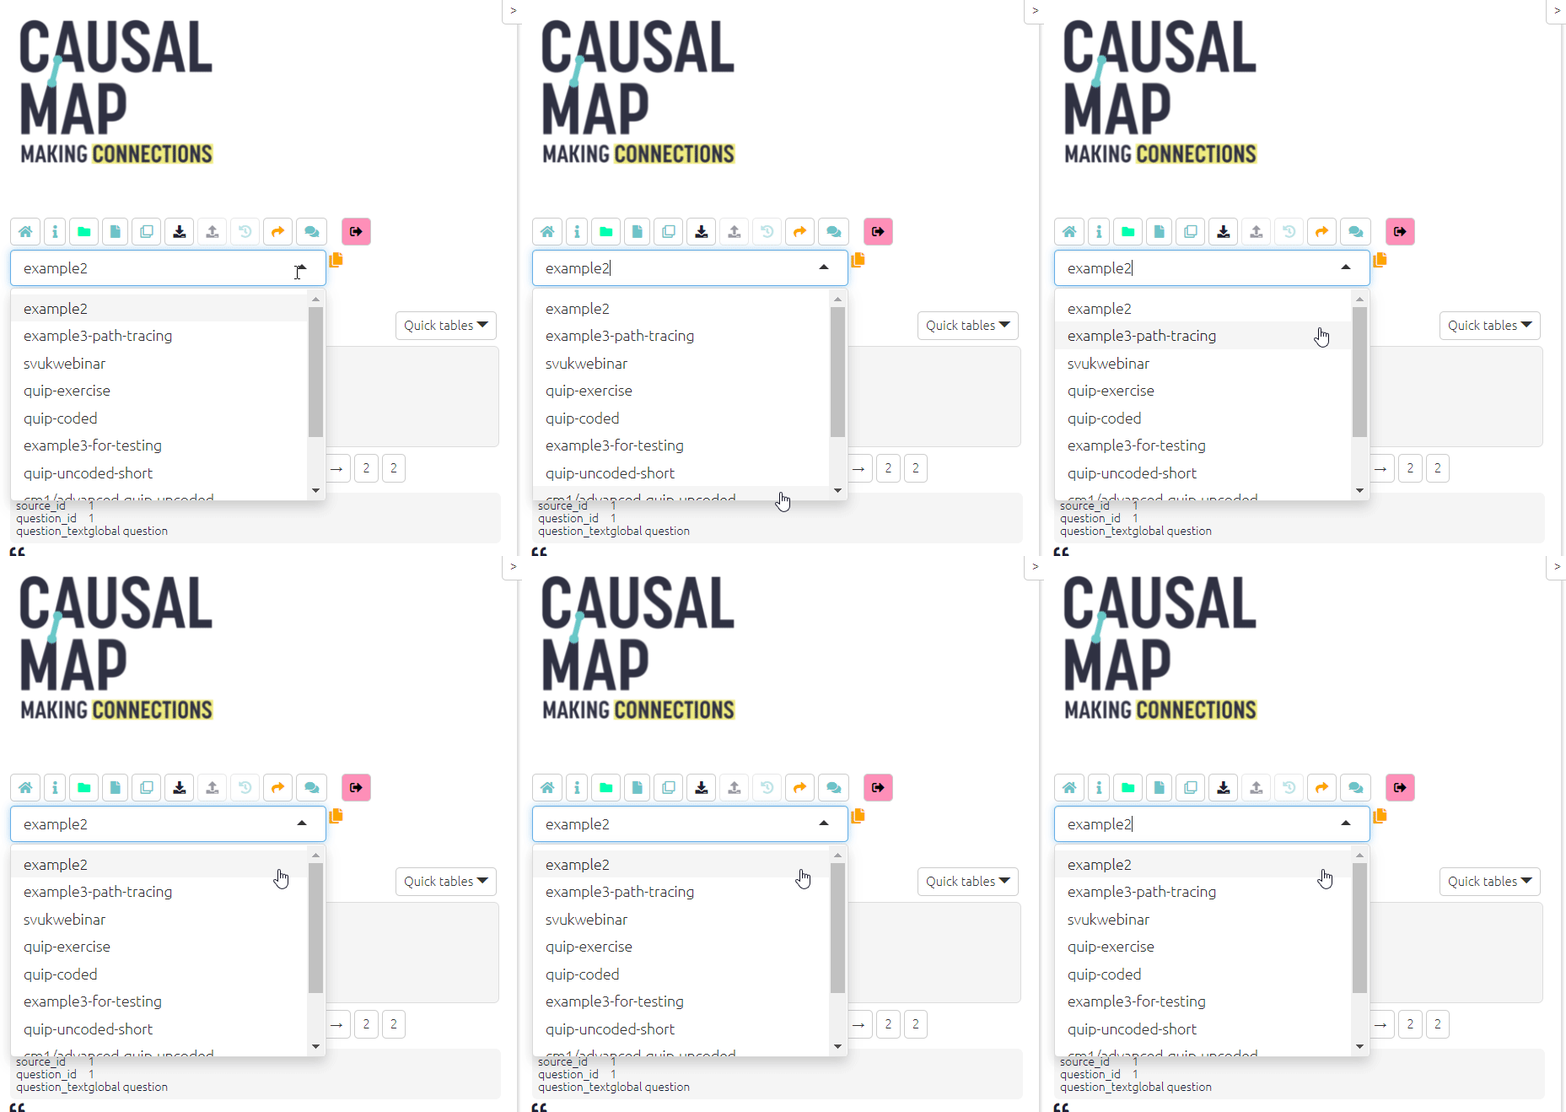
Most importantly, the top menu contains the “file dropdown menu” shown here. You use it to select what file you want to view or code.

If you have just loaded the app without clicking on a link, you will be taken to an example file called example-file. Other public files or files which have been shared with you are listed in this dropdown.
 If a file has this symbol, you can edit it, e.g. you can continue to code it.
 If a file has this symbol, you can view and analyse it but not edit it.
 If a file has this symbol, you can not edit it but you can make a copy which you can then edit.
Coding a file
If you want to practice coding, you will mostly use the left hand side of the app. You usually start off with an uncoded example file which the app creates for you. You can find it in the dropdown menu, it has a name like example-file-uncoded-youremailaddress.
Multiple statement selector

These buttons add the correct filters to either view just one statement at a time or many statements.
When you are coding you should click One to view just one statement at a time. Then you will see the navigation bar displayed below.

You can use the arrow buttons to skip through statements. The –> button takes you to the next statement.
Viewing and analysing a file
Analysing a file means
applying different filters to it, to focus on different parts of the entire causal map in order to answer different questions
viewing the results in different ways by clicking on different tabs in the right hand side to view different kinds of graphical map and various tables.
If you want to view / analyse a file, you will mostly:
- use the right-hand side of the app and the Dashboard
- view many statements at a time by clicking
Manyon the multiple statement selector (above). - start off by analysing the example-file.
The Dashboard
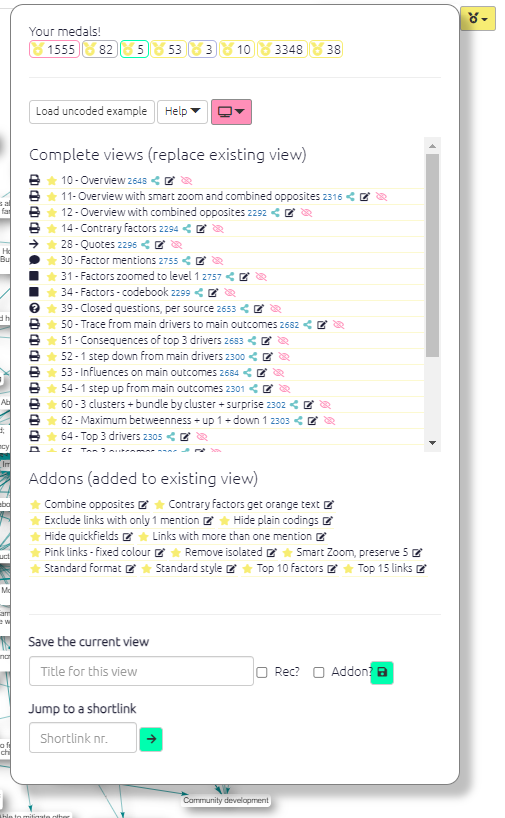
The Dashboard appears on the right as the app loads, or reveal it by pressing the yellow button at top-right: 

Each item in the dashboard is a different view of the current file saved by you or other users. You can apply a view by clicking on the corresponding row. You can see more about The Dashboard here
The other tabs
There are other tabs on the right hand side. You won’t need these when you are just getting started.
Factor Editor make advanced edits to your factor labels.
Files tab manage all your files.
Updates tab see activity on your files.
Data tab see summary data about the current file such as number of factors
Account tab manage your subscriptions and teams.